

Let’s be real — crypto markets move fast. One minute, your favorite altcoin is mooning. The next, it’s crashing harder than your weekend plans. If you’re trading based on gut feelings and Twitter hype, you might as well be flipping a coin.
That’s where chart indicators come in. They help you cut through the noise, spot trends, and make smarter trades instead of just hoping for the best. But with so many indicators out there, it’s easy to get lost in a sea of fancy lines and numbers.
This post breaks down seven of the most useful indicators for crypto trading. No fluff, no overcomplicated jargon. Just the tools you actually need to read the market like a pro.
Why trading indicators are important to master?
Jumping into crypto trading without understanding indicators is like driving blindfolded — exciting, maybe, but mostly just a terrible idea. The crypto market moves fast, and if you don’t have the right tools to read price action, you’re basically guessing. And guessing doesn’t pay the bills.
Indicators help traders spot trends, confirm signals, and time their trades more effectively. Instead of relying on gut feelings or social media hype, you can use data-driven insights to make better decisions.
Why are trading indicators a must for every trader?
- They help you read market trends
Imagine you see Bitcoin pumping, but is it just a temporary spike or the start of a real uptrend? Indicators like Moving Averages can help confirm whether a trend is actually forming or if you’re just catching a short-lived price jump. - They give buy and sell signals
Ever bought at the top thinking the price would keep rising, only to watch it dump right after? Indicators like the Relative Strength Index (RSI) can show whether an asset is overbought (likely to drop soon) or oversold (potentially due for a bounce). - They reduce emotional trading
Fear and greed rule the markets, but indicators help keep emotions in check. A trader using Bollinger Bands, for example, might notice price volatility narrowing, signaling an incoming breakout — helping them stay patient instead of panic buying or selling. - They work in any market condition
Whether crypto is booming or in a brutal downtrend, indicators provide valuable insights. Volume indicators can confirm whether a breakout has real strength behind it, while MACD (Moving Average Convergence Divergence) helps traders ride trends rather than getting caught in fake moves.
The perfect starting point for new traders
If you’re new to crypto, learning indicators is one of the best ways to understand market behavior. You’ll start seeing patterns, recognizing trends, and understanding why prices move the way they do. Instead of relying on luck, you’ll have a strategy.
Mastering indicators won’t turn you into a trading wizard overnight, but they will give you an edge. And in a market as unpredictable as crypto, that edge can make all the difference.
Types of crypto trading indicators
Not all trading indicators work the same way. Some sit directly on the price chart, while others live below it, moving up and down like a heartbeat monitor. Understanding these differences is key to using them effectively.
Overlays – The indicators that follow price
Think of overlays as guides that sit on top of your price chart, moving along with it. These indicators help you see trends, support and resistance levels, and potential breakout points.
Example: Moving Averages, Bollinger Bands
How they help: Overlays smooth out price action, helping traders spot trends more clearly. If you’ve ever tried to figure out whether Bitcoin is actually trending up or just having a lucky day, overlays can make that decision easier.
Oscillators – The market’s mood swings
Oscillators, on the other hand, live below the main chart and tell you when an asset might be overbought (too expensive) or oversold (too cheap). They measure momentum and can help predict potential reversals before they happen.
Example: RSI, MACD, Stochastic Oscillator
How they help: Oscillators act like a market mood detector. They help traders see when an asset is overheating and due for a cooldown — or when it’s been beaten down and might be ready for a comeback.
Leading vs. lagging indicators – predicting vs. confirming
Not all indicators are created equal. Some try to predict what will happen next (leading indicators), while others confirm what’s already happening (lagging indicators).
- Leading indicators give early signals before a trend forms. They’re great for spotting potential opportunities but can sometimes be too early, leading to false alarms.
Example: RSI, Stochastic Oscillator - Lagging indicators wait until a trend is already in motion before confirming it. They help traders avoid fake-outs but sometimes signal too late.
Example: Moving Averages, MACD
So, which one is better?
Neither — both have their place. Leading indicators help with timing while lagging indicators help with confirmation. Smart traders often use a mix of both.
Now that we’ve got the basics down, let’s break down the most useful indicators and how you can actually use them in your trades.
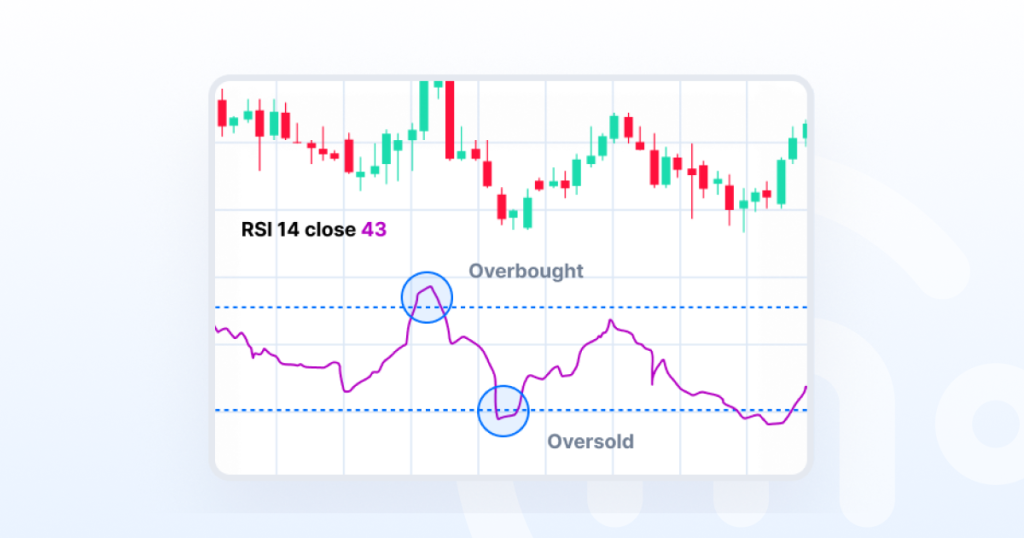
Relative Strength Index (RSI) – Spotting overbought and oversold conditions
The Relative Strength Index is like a market speedometer — it tells you if an asset is moving too fast in one direction and might need to slow down.
How it works
RSI is a momentum indicator that measures how strong recent price movements are. It runs on a scale from 0 to 100:
- Above 70? The asset is overbought — it’s been rising too fast, and a pullback could be coming.
- Below 30? The asset is oversold — it’s been dropping too fast, and a bounce could be on the way.
It’s like watching someone sprint — if they’ve been running full speed for a while (RSI above 70), they’ll probably have to slow down soon. If they’ve been crawling (RSI below 30), they might be gearing up to start running again.
How traders use RSI
- Spotting reversals: If RSI is above 70, it’s a sign the asset might be due for a price drop. If it’s below 30, it could be a buying opportunity before the price rebounds.
- Confirming trends: RSI isn’t just about overbought/oversold signals—it can also confirm strong trends. If RSI stays above 50 during an uptrend, the momentum is solid.
- Divergence signals: If the price is making new highs, but RSI isn’t, that’s a warning sign that the trend might be losing steam. The same goes for price-making new lows while RSI refuses to drop further — it could mean a reversal is coming.
When to use RSI?
RSI is most useful in sideways markets where prices are bouncing between support and resistance levels. However, in strong trends, RSI can stay overbought or oversold for a long time, so it’s not always a perfect buy/sell signal.
Bollinger Bands – Spotting volatility like a pro
Bollinger Bands might sound fancy, but they’re basically a volatility radar for crypto traders. They help you see when a coin is trading calmly or getting ready for a big move.
How it works
Imagine Bollinger Bands as a rubber band around the price. This band expands when the market is wild and contracts when things are quiet. It consists of:
- A middle line (the moving average) – the coin’s average price over a set period.
- An upper band – the price’s “ceiling.”
- A lower band – the price’s “floor.”
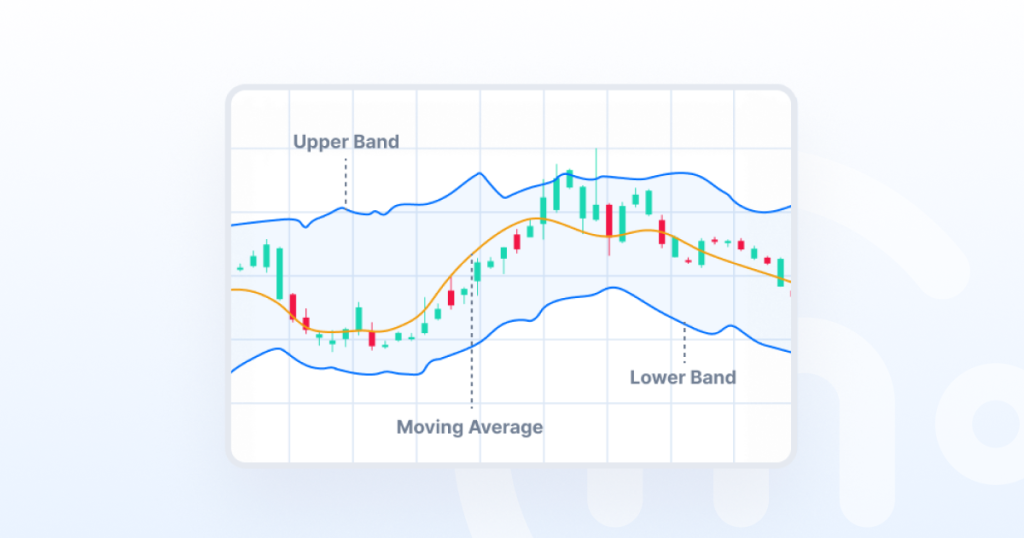
When prices move close to the upper band, the asset might be overbought (too expensive). When it touches the lower band, it could be oversold (too cheap).
How traders use Bollinger Bands
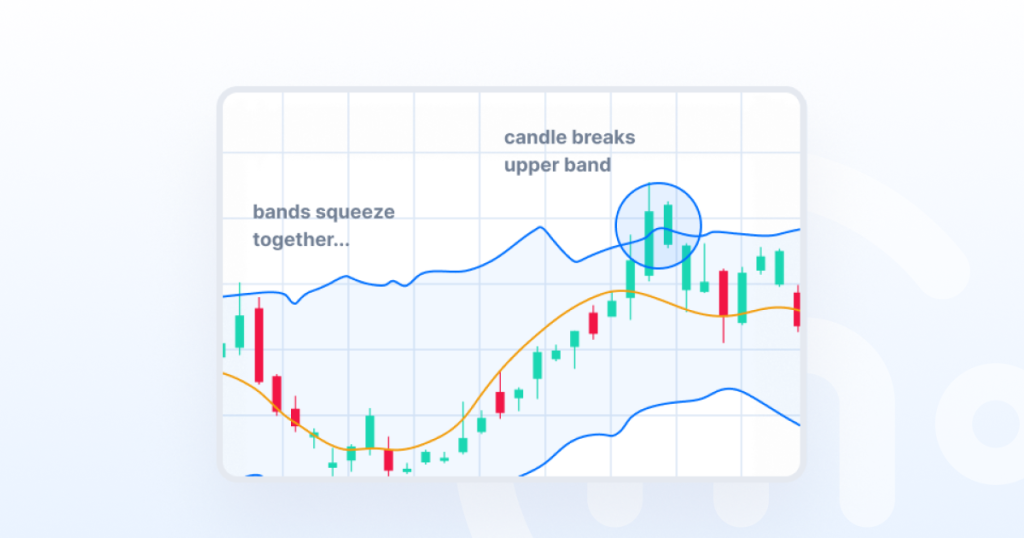
Spot breakouts – When the bands squeeze together (low volatility), a breakout could be coming. Think of it like a coiled spring — when it finally snaps, price action can be explosive.
Identify overbought & oversold conditions – If the price hugs the upper band, it might be time for a pullback. If it’s clinging to the lower band, a bounce could be near.
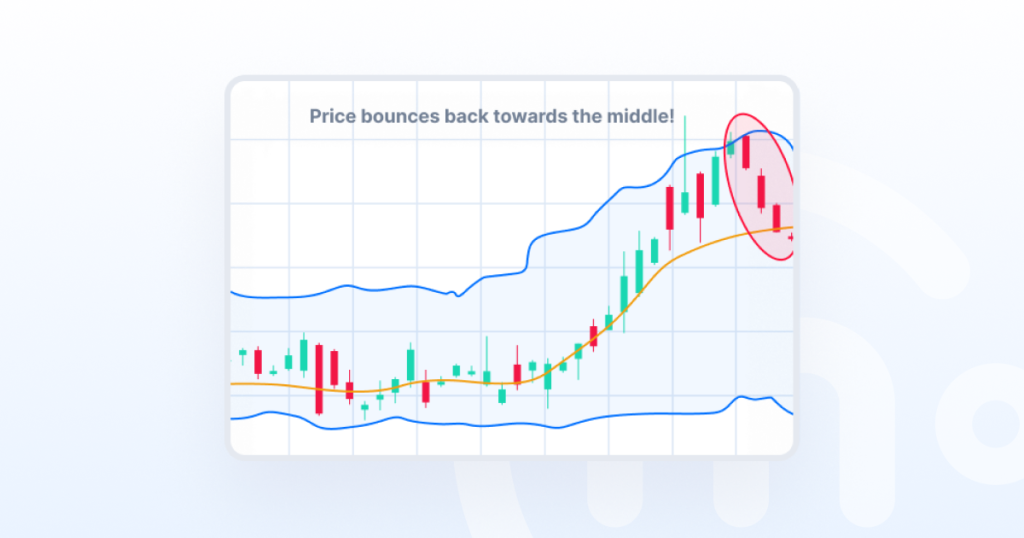
Confirm trend strength – In a strong uptrend, the price will often ride the upper band without breaking down. In a downtrend, it’ll stay near the lower band. If that pattern shifts, it might signal a trend change.
When to use it?
- Great for volatile markets – Crypto loves wild price swings, and Bollinger Bands help traders prepare for them.
- Useful for timing entries & exits – Whether you’re looking for a breakout or a bounce, these bands provide clear visual cues.
Just remember — Bollinger Bands don’t predict the direction of a breakout, just that a big move is coming. That’s why traders often combine them with other indicators for confirmation.
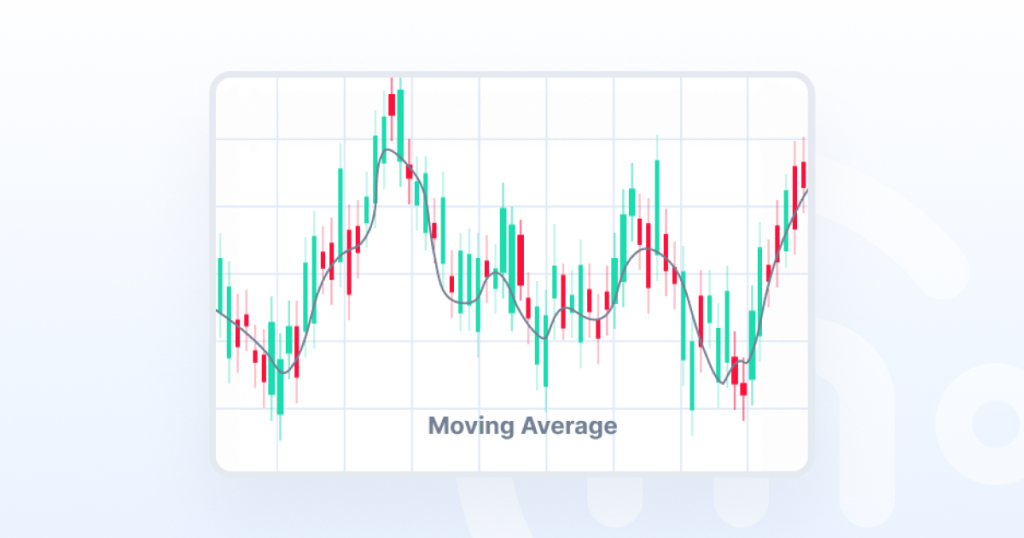
Moving Averages (SMA & EMA) – The market’s trend tracker
Moving averages are like a GPS for price trends. Instead of getting lost in every little price jump, they smooth out the noise and show where the market is actually headed.
There are two main types:
Simple Moving Average (SMA) – The classic trend line
SMA calculates the average price over a specific period (e.g., 50 days). It gives equal weight to all prices in that period, making it a steady and reliable trend tracker.
How traders use it:
- If the price is above the SMA, it signals an uptrend (buyers are in control).
- If the price is below the SMA, it suggests a downtrend (sellers are dominating).
- SMAs also act as support or resistance levels — prices often bounce off them like an invisible wall.
Best for: Identifying long-term trends and key price levels.
Exponential Moving Average (EMA) – The faster signal
EMA works like SMA but gives more weight to recent prices, making it react faster to price changes. It’s like an SMA on caffeine — quicker to respond, but sometimes a little jumpy.
How traders use it:
- Short-term traders prefer EMA because it reacts faster to price shifts.
- Common strategy: Golden Cross & Death Cross
- When a short-term EMA (e.g., 50-day) crosses above a long-term EMA (e.g., 200-day) → Bullish signal (Golden Cross)
- When a short-term EMA crosses below a long-term EMA → Bearish signal (Death Cross)
Best for: Catching trends early but requires more confirmation from other indicators to avoid false signals.
When to use Moving Averages?
- Spotting overall market direction — use longer periods (e.g., 200-day SMA)
- Finding entry and exit points — watch for prices crossing the MA
- Identifying support & resistance — prices often bounce off moving averages
Moving averages aren’t magic, but they help filter out market noise and give traders a clearer picture of the trend. Up next, let’s talk about how to spot trends with the MACD.
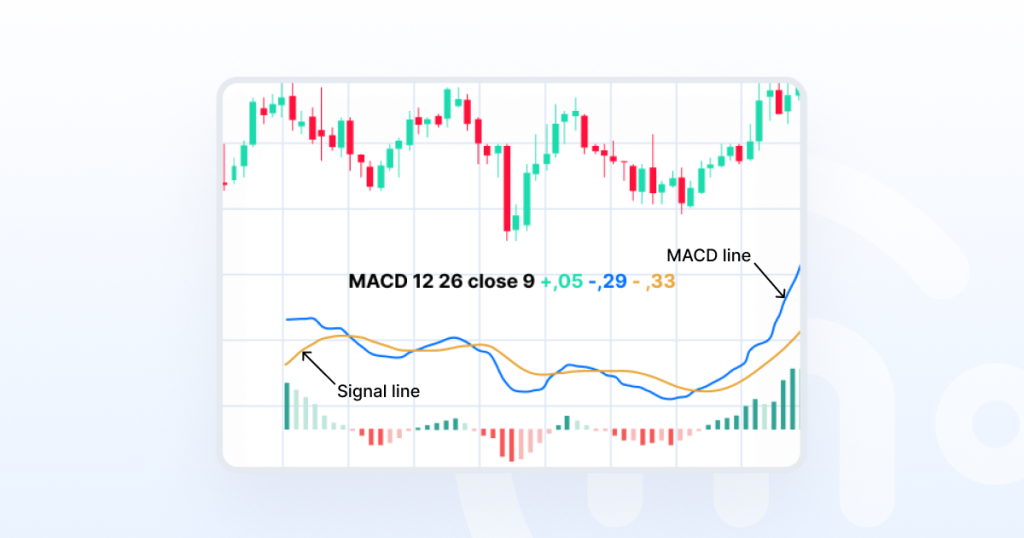
MACD – Catching trends with momentum
The MACD (Moving Average Convergence Divergence) might sound complicated, but don’t let the name scare you. At its core, MACD is just a tool that helps traders figure out when a trend is gaining or losing strength —which is pretty useful when you’re trying to time your trades.
How it works
MACD is made up of two moving averages: a signal line, an MACD line, and a histogram (a bar chart that shows momentum).
- When the two lines cross → It can signal a potential trend change.
- When the histogram bars grow → Momentum is strong.
- When the bars shrink → The trend might be running out of steam.
How traders use MACD
Spotting trend reversals
- If the MACD line crosses above the signal line, it could mean a bullish trend (good time to buy).
- If the MACD line crosses below the signal line, it could mean a bearish trend (potential sell signal).
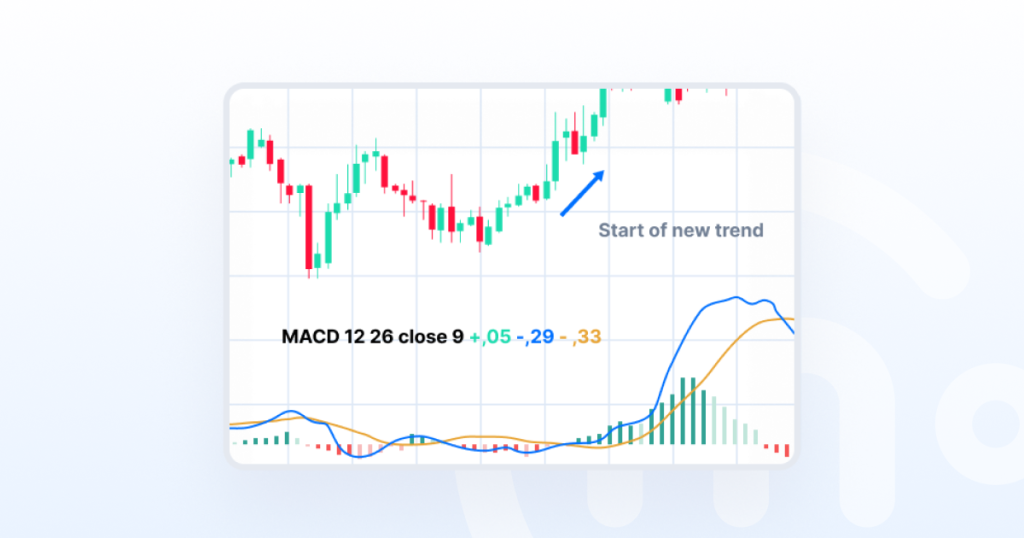
Confirming a trend
- If the histogram bars are growing, the trend is strong.
- If they start shrinking, the trend might be losing power.
Avoiding fakeouts
Many traders use MACD alongside other indicators (like RSI) to avoid false signals.
When to use MACD
Best for swing traders looking to ride trends rather than catch every small move.
Works well in trending markets, but not great in sideways (choppy) conditions.
Good for confirming breakouts — if MACD shows strong momentum, the breakout is more likely to hold.
Think of MACD as a trend strength meter. It won’t predict the future, but it can help you see when a move has real power behind it — or when it’s just running on fumes.
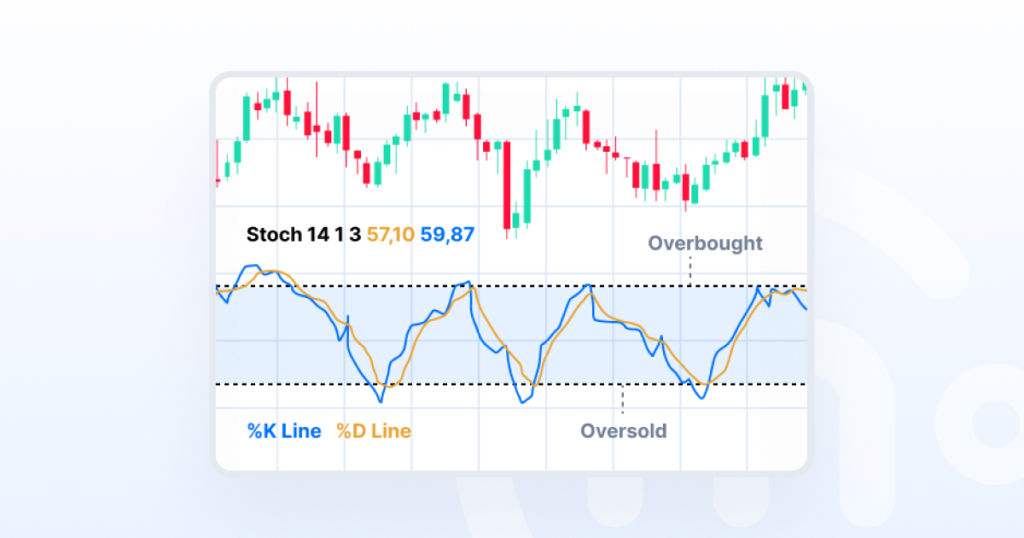
Stochastic Oscillator – Catching market exhaustion before it turns
The Stochastic Oscillator is like a fuel gauge for price momentum — it tells you when an asset is running out of gas and might be due for a reversal. Stochastic Oscillator consists of a %K line and a %D line, which can be used to generate signals after crossovers.
It doesn’t just track price movement; it measures how strong that movement is compared to recent price history.
How it works
Picture a runner sprinting down a track. They might be going full speed, but at some point, their energy starts to drain before they actually stop. The Stochastic Oscillator works the same way — it helps traders see when price momentum is slowing before an actual reversal happens.
It moves on a scale from 0 to 100, with two key danger zones:
Above 80 → Overbought: The asset might be running out of steam and could reverse downward.
Below 20 → Oversold: The asset might be exhausted from selling pressure and could bounce back up.
How traders use it
- Spotting trend reversals: If the oscillator climbs above 80 and starts turning down, it’s a sign that buying momentum is fading. If it drops below 20 and begins to rise, selling pressure might be easing.
- Confirming entry & exit points: Many traders look for crossovers between the two lines on the Stochastic chart—when they cross in overbought or oversold zones, it can signal a potential reversal.
- Avoiding FOMO & panic selling: Just because an asset is pumping doesn’t mean it will keep going. If the Stochastic Oscillator is flashing “overbought,” it could mean a cooldown is coming. Likewise, an “oversold” signal might hint at a recovery.
When to use it
Best for: sideways, range-bound markets where prices move between highs and lows.
Less reliable in strong trends — crypto can stay “overbought” or “oversold” for long periods during bull or bear runs.
Average Directional Index (ADX) – Measuring trend strength
The Average Directional Index (ADX) is like a volume knob for market trends — it doesn’t tell you which direction the market is going, but it does tell you how strong the trend is. If you’ve ever jumped into a trade only to realize the trend was too weak to last, ADX can help you avoid that mistake.
How it works
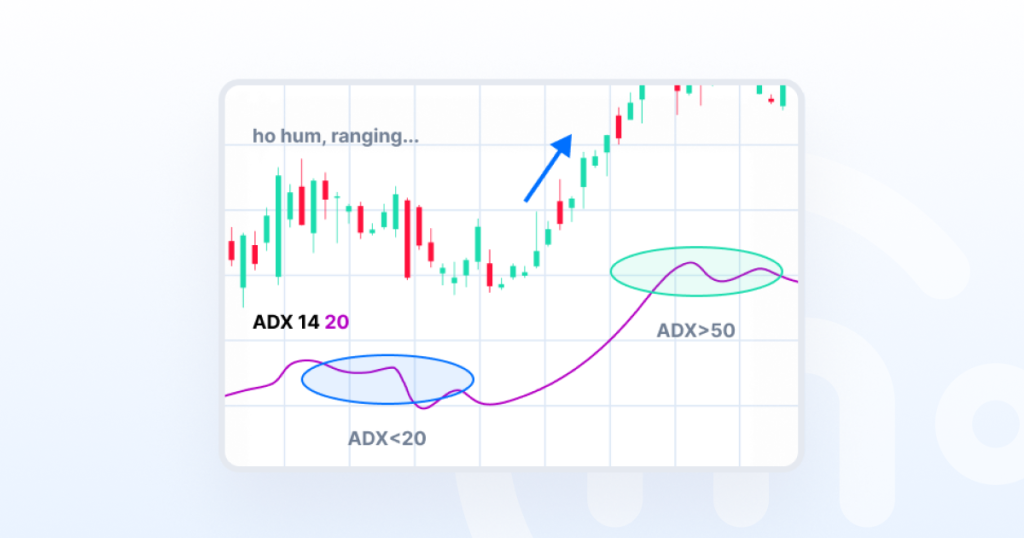
ADX moves on a scale from 0 to 100, with higher numbers indicating a stronger trend.
- Below 20 → Weak trend or no trend at all (sideways market).
- 20 to 40 → A developing trend with moderate strength.
- Above 40 → A strong trend with momentum behind it.
Unlike some indicators that focus on price levels, ADX is all about trend strength. It works alongside two other lines — +DI (positive directional indicator) and -DI (negative directional indicator) — which show whether the trend is bullish or bearish. But the ADX line itself is just measuring how powerful the trend is, regardless of direction.
How traders use it
- Confirming strong trends – If ADX is above 25-30, it suggests the trend has enough strength to continue. This helps traders avoid getting caught in weak moves.
- Avoiding choppy markets – If ADX is below 20, the market is likely in a range, meaning breakouts are less reliable.
- Spotting trend reversals – A rising ADX means the trend is getting stronger. A falling ADX after a big move can hint that the trend is losing steam.
When to use it
ADX is especially useful for traders who want to follow trends rather than get caught in false breakouts. It’s best used:
- When deciding whether a trend is worth trading.
- Alongside other indicators like Moving Averages or RSI for confirmation.
- In trend-following strategies, rather than range-bound markets.
Parabolic SAR – Spotting trend direction and reversals
The Parabolic SAR (Stop and Reverse) is like a trail of breadcrumbs that helps traders follow a trend and know when it might be time to jump ship. It places small dots on the chart — either above or below the price — to signal the direction of a trend and potential reversals.
How it works
- When the dots are below the price, it suggests an uptrend — the market is moving higher.
- When the dots are above the price, it signals a downtrend — the market is moving lower.
- When the dots flip sides, it could mean the trend is reversing.

As long as the dots stay on the same side, the trend is still in play. But when they switch positions, it may be a sign to exit a trade or prepare for a new trend.
How traders use it
- Riding the trend – Traders use Parabolic SAR to stay in a trade as long as the dots remain on the correct side of the price.
- Setting Stop-Loss levels – Since the dots move closer to the price as a trend develops, traders can use them as a guide for trailing stop-losses to lock in profits.
- Identifying trend reversals – A dot flip can act as an early warning that momentum is shifting, signaling a potential exit or a new trade opportunity.
When to use it
Parabolic SAR works best in strong trending markets, where prices are moving consistently in one direction. However, it can be unreliable in sideways or choppy markets, where frequent dot flips may generate false signals.
Final Thoughts – Mastering indicators through practice
Trading indicators are powerful tools, but they aren’t magic wands. They won’t guarantee profits, but they will help you make more informed decisions, spot trends early, and avoid unnecessary risks. The key is knowing how to use them in the right market conditions and combining them for better accuracy.
All the best trading indicators we covered — Stochastic Oscillator, ADX, Parabolic SAR, and more — are available in Pro mode in the Cryptomania trading simulator. It’s the perfect place to practice using these tools in real market conditions without the risk of losing real money.
The best way to get better at technical analysis is by testing different indicators, seeing how they behave in different trends, and learning how to filter out false signals. So, if you want to level up your trading skills, dive into the simulator and start experimenting. The more you practice, the sharper your trading instincts will become.
