

Trading Charts 101: A Beginner’s Guide to Reading Crypto Charts
Vuk Martinovic
If you’ve ever looked at a crypto or stock chart and thought, “What am I even looking at?” — you’re not alone. To a beginner, trading charts can seem like a confusing mess of lines, bars, candles, and weird shapes. But once you understand how to read trading charts, they become one of the most powerful tools in your trading toolbox.
Charts help you make sense of what the market is doing. They show you where prices have been, where they are likely headed, and how traders are reacting in real-time.
In this guide, I’ll break down the basics of trading charts in a way that actually makes sense. We’ll go over the main types of charts, what all the squiggly lines and bars mean, and some simple patterns that can help you spot potential trends or reversals.
3 main types of trading charts
Before you start spotting trends or using indicators, you need to know what kind of chart you’re actually looking at. Different chart types show price data in different ways — some are super simple, and others give you more details.
Let’s break down the three most common ones you’ll come across:
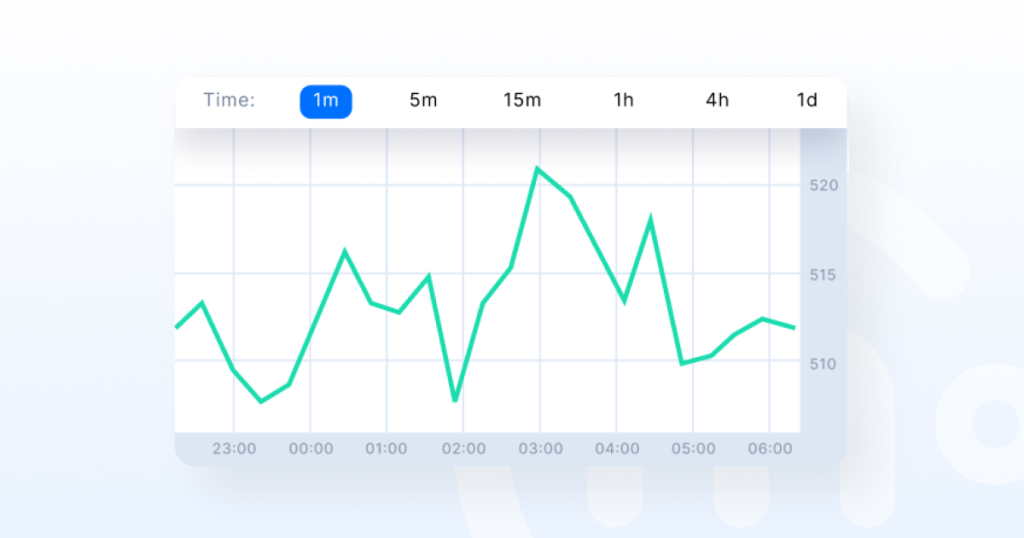
Line chart
If you’re just starting out, line charts are the easiest to understand. They show a single line that connects the closing prices of an asset over a set period of time. It’s like drawing a dot at the end of each day’s price and connecting the dots.
Why use it?
It’s clean and easy on the eyes. If you want a quick snapshot of whether the price is going up or down over time, a line chart gets the job done.
What’s missing?
You won’t see important info like the opening price, daily highs/lows, or how volatile the price was during the day. It’s basic— but that’s also why some traders like it.
Bar chart
Bar charts take it up a notch. Instead of a single line, each “bar” shows the opening price, closing price, high, and low for a specific time period.
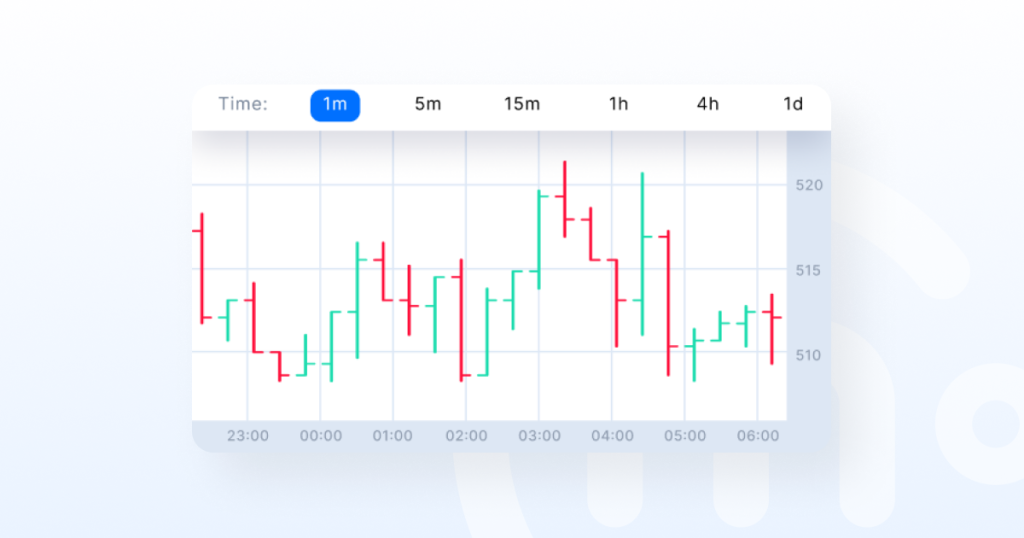
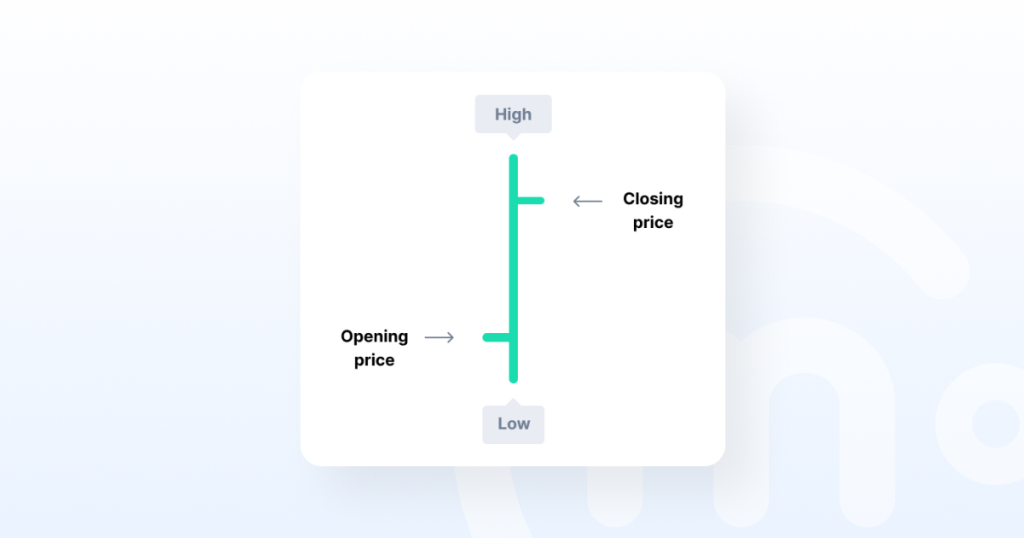
Here’s how to read it:
- The top of the bar = highest price
- The bottom of the bar = lowest price
- A small tick on the left = opening price
- A small tick on the right = closing price
Why use it?
You get a fuller picture of what happened during that time frame — great if you want more detail without too much clutter.
What’s the catch?
It’s a bit harder to read at a glance, especially if you’re new.
Candlestick chart
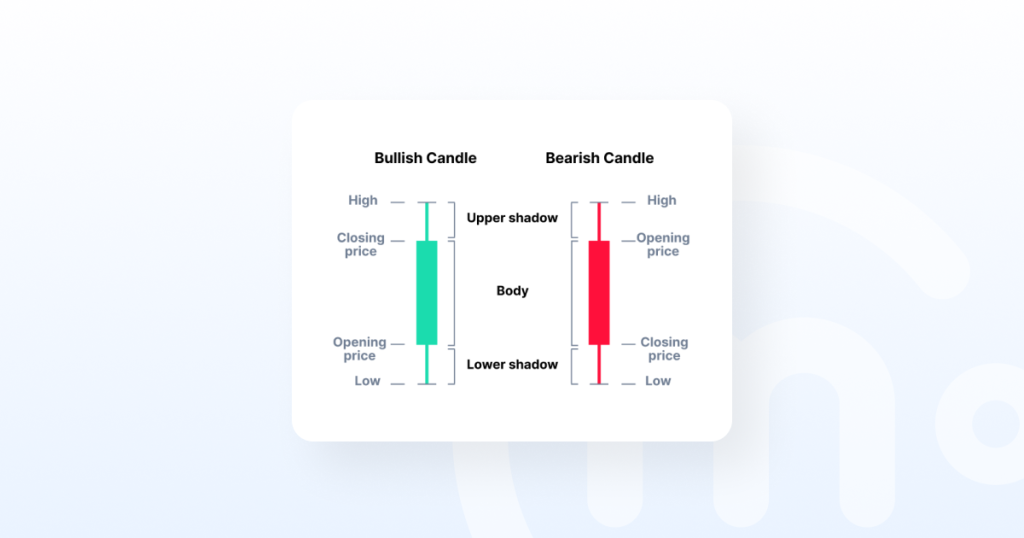
This is the chart most traders use, and for good reason. Candlestick charts show the same info as bar charts (open, high, low, close), but in a format that’s easier to understand visually.
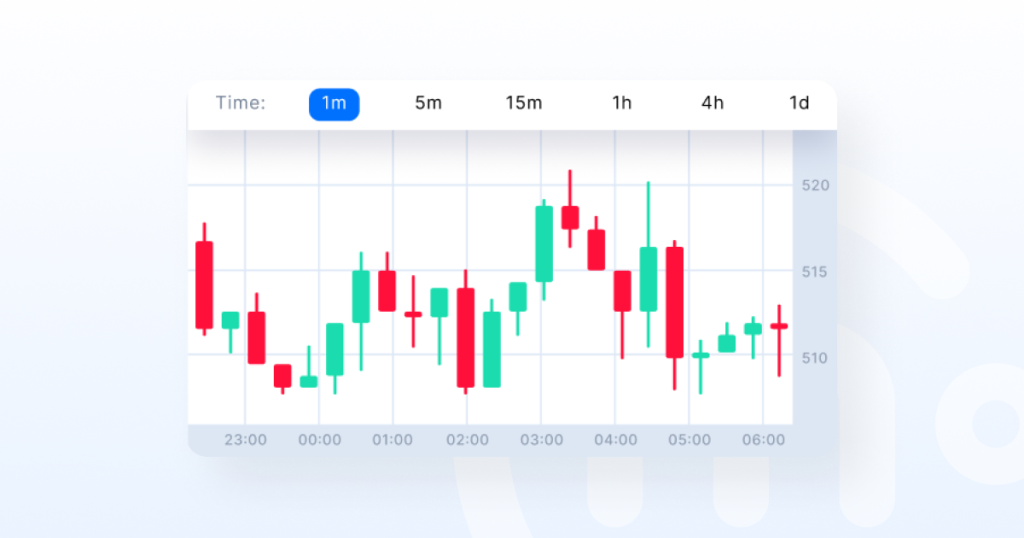
Each “candle” has a body and wicks (or shadows):
- The body shows the open and close.
- The wicks show the high and low.
- If the candle is green (or white), the price went up.
- If it’s red (or black), the price went down.
Why use it?
Candlesticks make it easier to spot patterns, trends, and momentum. Once you learn how to read them, you’ll start to see market behavior in a whole new way.
Bottom line?
If you’re serious about trading, candlestick charts are where you’ll spend most of your time.
Anatomy of a crypto trading chart
Once you’ve picked a chart type, the next step is understanding what you’re actually looking at. A trading chart might seem packed with info, but it’s really just showing three main things:
- Price
- Volume
- Time
Let’s break it down.
Price and time: Y-Axis vs X-axis
Every chart has two axes:
- The Y-axis (vertical) shows price — how much the asset is worth.
- The X-axis (horizontal) shows time — when those price changes happened.
Think of it like this: you’re looking at the price of an asset as it moves through time. That’s the foundation of all trading charts. Whether you’re checking out crypto, Forex, or tech stock, it’s always a battle between price and time.
Volume
Right under most price charts, you’ll see bars called volume. Volume shows how many units of the asset were traded during a certain time period. High volume = lots of interest and activity. Low volume = less interest and activity.
Why does this matter?
Volume helps you confirm moves. If a price spike happens with high volume, that move is more likely to be real. But if the price jumps with barely any volume? Could be a fake-out. Experienced traders always check volume before trusting a breakout or trend.
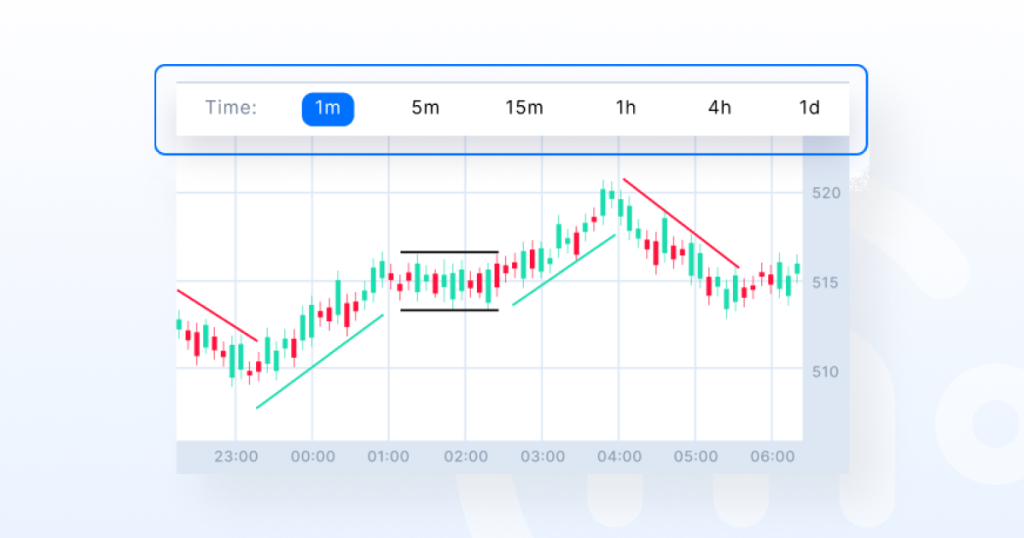
Timeframes
Trading charts let you zoom in or out on different timeframes, depending on how much data you want to see. The most common timeframes are:
- 1-minute / 5-minute: Used for fast-paced day trading
- 15-min / 1-hour: Good for short-term plays
- 4-hour / daily: Ideal for swing traders
- Weekly / monthly: Used by long-term investors
What should beginners use?
Start with the daily chart. It gives you a clear, less noisy view of trends. Once you’re more comfortable, you can start exploring shorter timeframes to fine-tune your entries and exits.
Crypto chart indicators
Once you’re comfortable reading charts, you’ll probably want to take things a step further. This is where crypto chart indicators come in.
What is an indicator?
In simple terms, an indicator is a tool you add to your chart that helps you spot trends, momentum, and potential entry or exit points. Think of indicators like extra layers of information that help you make smarter decisions. They don’t predict the future, but they do help you better understand what the market is doing right now.
Going back to the previous metaphor, if trading charts are like maps, indicators are like an X that marks the spot, or an arrow that points to what you need.
Let’s go over a few of the best trading indicators for crypto that beginners should get to know.
Moving Averages
A moving average smooths out price data so you can see the overall trend without all the daily noise.
- SMA = Simple Moving Average (a basic average of past prices)
- EMA = Exponential Moving Average (reacts faster to recent price changes)
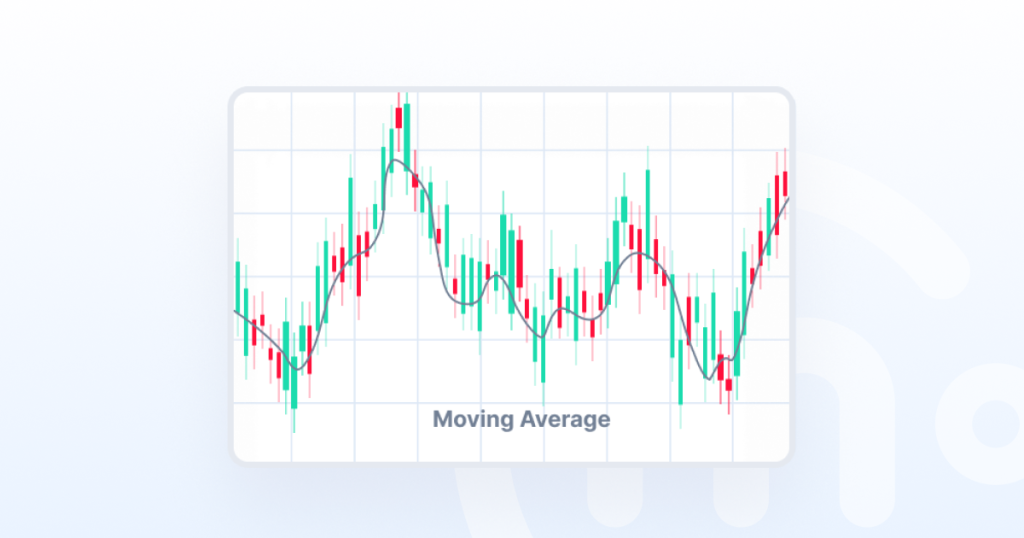
Why it’s useful:
Moving averages help you spot the trend. There are three main ones:
- Up
- Down
- Sideways (neutral)
They can also act as support or resistance levels. Many traders use two MAs together (like the 50-day and 200-day) to find trend shifts.
RSI (Relative Strength Index)
The RSI measures how fast and how much the price has moved recently. It tells you if something is overbought (maybe time to sell) or oversold (maybe time to buy).
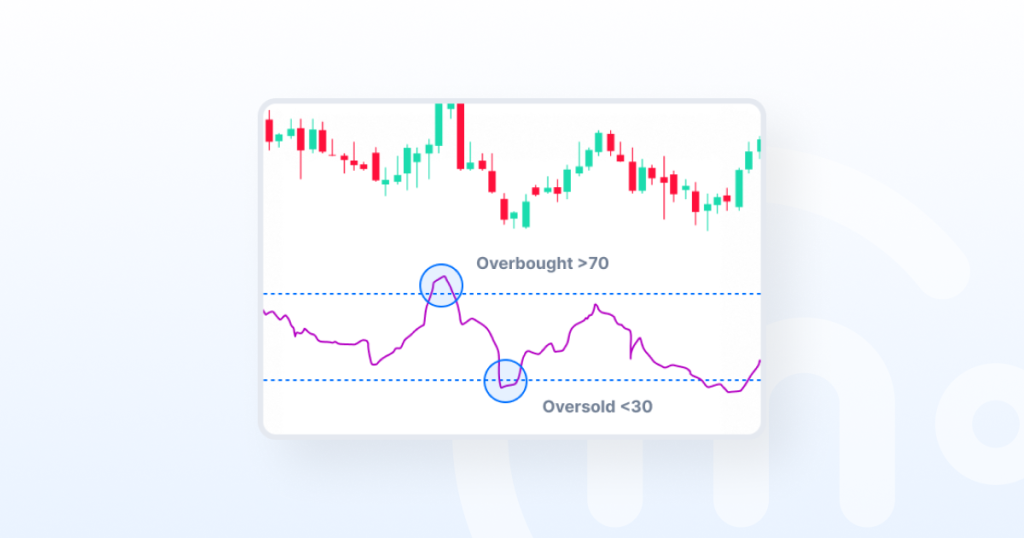
Why it’s useful:
If the RSI is above 70, the asset might be overbought. Below 30? It might be oversold. It helps you spot when a trend could be starting to change.
MACD (Moving Average Convergence Divergence)
The MACD is a bit more advanced, but still good to know. It compares two moving averages and helps you see when momentum is shifting.
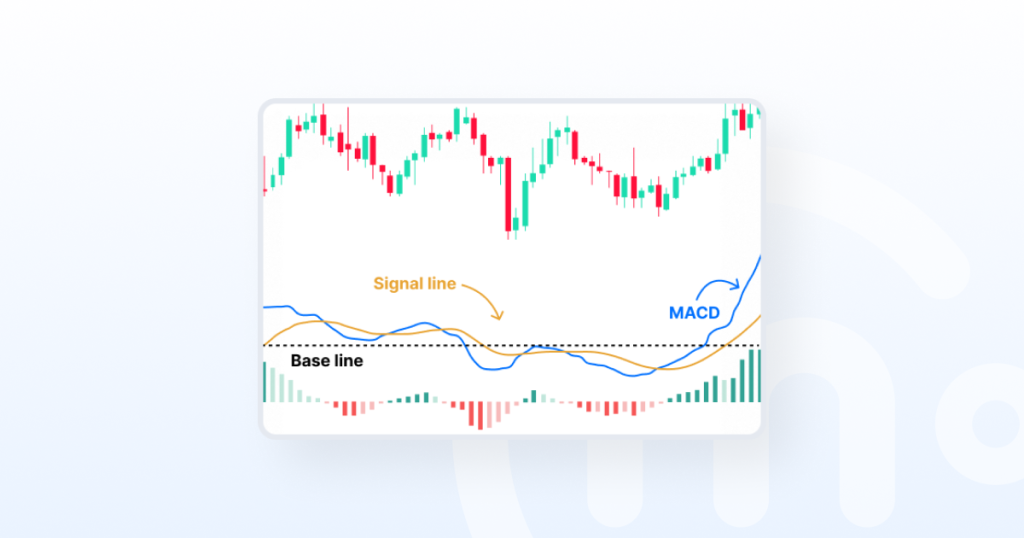
Why it’s useful:
MACD is great for spotting trend reversals and momentum changes. If you see the MACD line crossing over its signal line, that’s often a clue that the trend is changing.
You don’t need to use every indicator out there. Actually, using too many can just clutter your chart and confuse you. Start with one or two (like RSI and moving averages), get comfortable with them, and build from there.
Basic crypto trading chart patterns
Chart patterns are like the body language of the market. They don’t speak, but they signal what traders are feeling — like confidence, fear, or indecision. Once you learn to spot these patterns, you’ll start seeing them everywhere.
Here are some of the most common patterns that beginners should get familiar with. Each one tells a story about what the price might do next.
Head and Shoulders and its inverse version
What it looks like:
A central peak (the “head”) with two smaller peaks on either side (the “shoulders”).
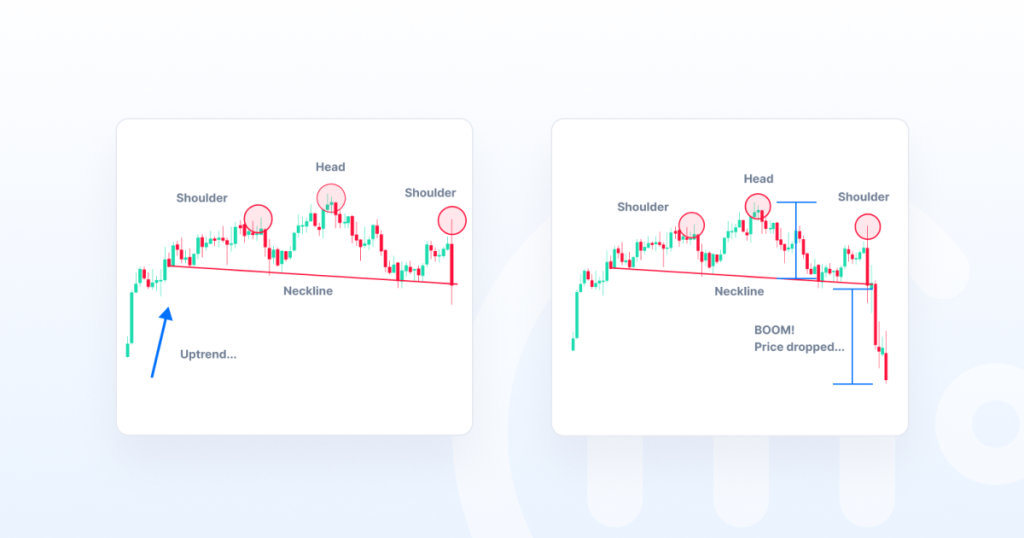
What it usually signals:
- Head and Shoulders = Trend reversal from up to down
- Inverse Head and Shoulders = Trend reversal from down to up
This is one of the most reliable reversal patterns in trading. It usually means the current trend is losing steam.
Wedges (rising and falling)
What they look like:
Price moves within two converging lines, forming a wedge shape.
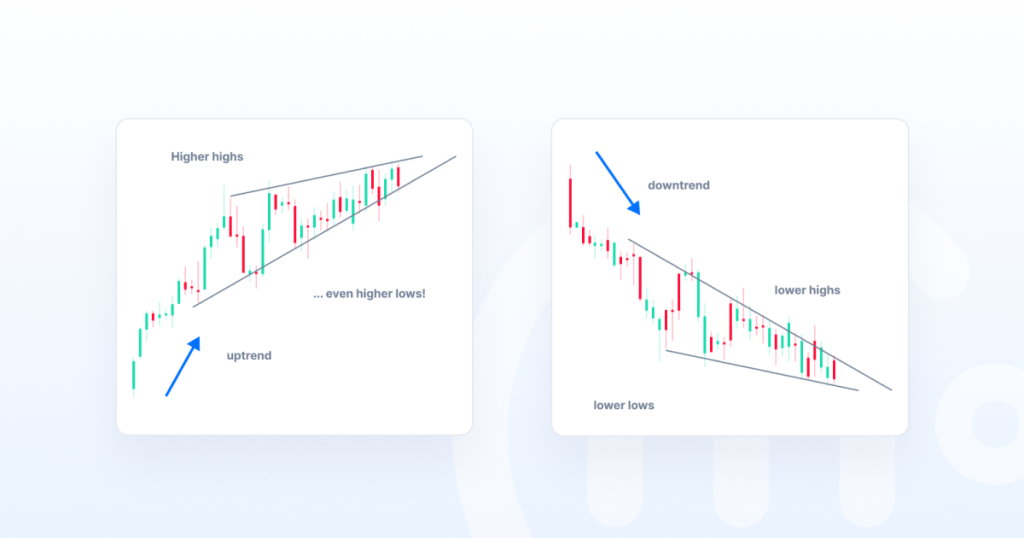
- Rising Wedge: slants upward
- Falling Wedge: slants downward
What they usually signal:
- Rising Wedge = Bearish (price may drop)
- Falling Wedge = Bullish (price may rise)
Wedges often show up before big breakouts or breakdowns.
Triangles (symmetrical, ascending, descending)
What they look like:
Price bounces between trend lines, forming a triangle shape.
Types & signals:
- Symmetrical Triangle = Could break out in either direction
- Ascending Triangle = Bullish (higher chance of breaking up)
- Descending Triangle = Bearish (higher chance of breaking down)
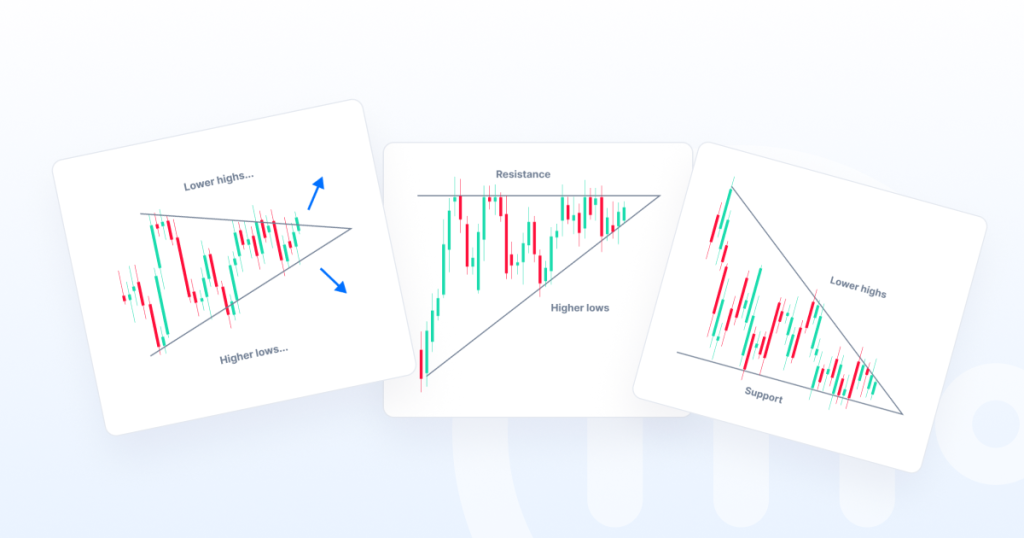
Triangles usually mean a breakout is coming — you just don’t always know which way until it happens.
Flags and pennants
What they look like:
A sharp price move (called the “flagpole”), followed by a tight consolidation that forms a small rectangle (flag) or a small triangle (pennant).
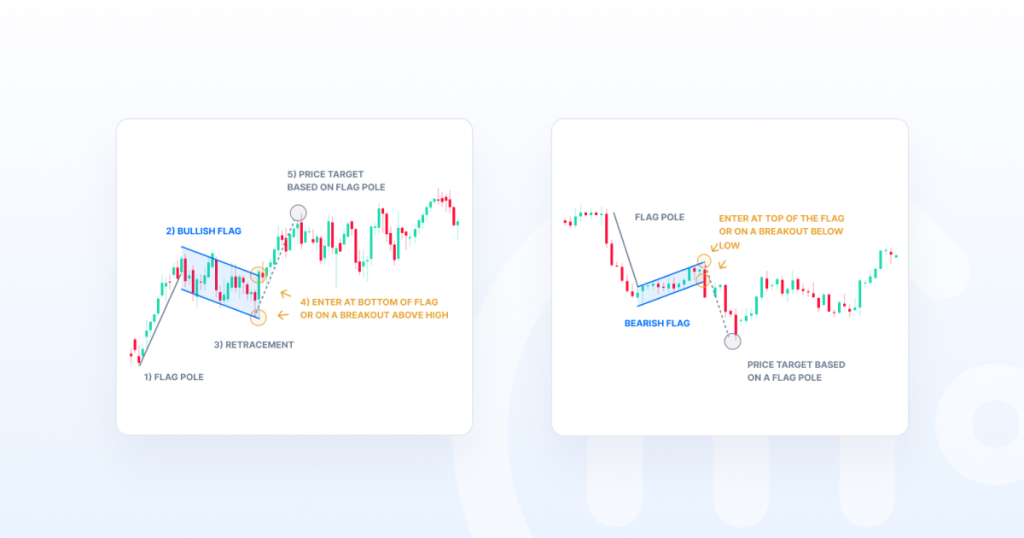
What they usually signal:
- Continuation of the previous trend.
- If the flag follows a strong upward move, it’s likely to break up.
- If it follows a sharp drop, it may break down.
These patterns are short-term pauses before the price keeps charging in the same direction.
Double Top and Double Bottom
What it looks like:
Price hits the same level twice before reversing.
- Double Top: Two peaks at roughly the same level
- Double Bottom: Two dips at roughly the same level
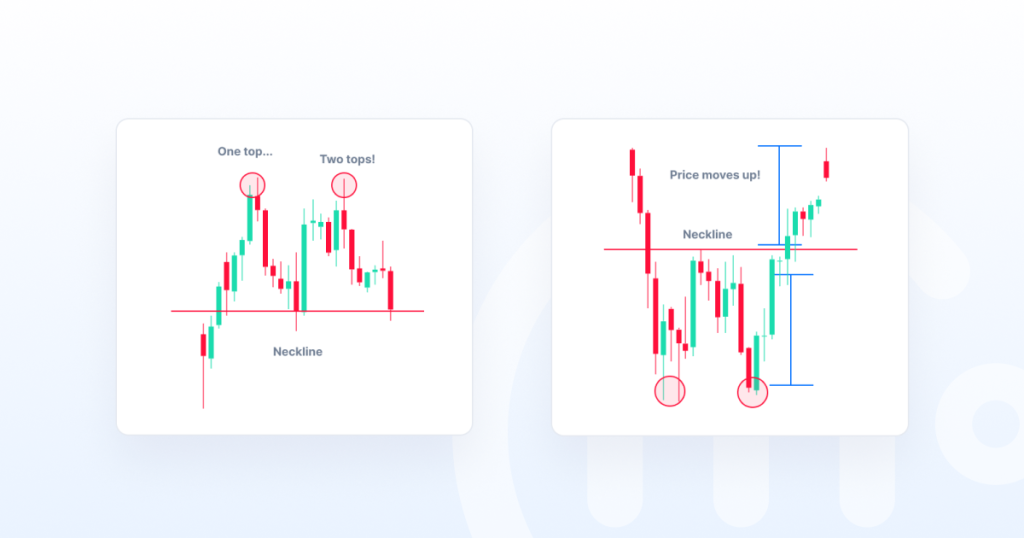
What it usually signals:
- Double Top = Bearish reversal (price may fall)
- Double Bottom = Bullish reversal (price may rise)
These are classic reversal patterns that often show up near major turning points.
Start by learning to recognize just one or two of these patterns on your charts. The more charts you study, the better you’ll get at spotting them in real time.
How to read a crypto chart like a pro
Learning to read crypto chart patterns is a skill — like guitar playing, or cooking. And like any skill, it gets better with practice. But when you’re just starting out, it’s easy to feel overwhelmed by all the lines, indicators, and patterns. The good news is — you don’t need to learn everything at once.
Here are a few simple tips to help you stay focused and build real confidence:
Don’t overcomplicate it
You don’t need a dozen crypto chart indicators and fancy setups to be a good trader. In fact, too many tools can actually confuse you and lead to “analysis paralysis.”
Stick with a couple of patterns and one or two basic indicators (like RSI or moving averages) until you understand how they work. Keep it simple and build from there.
Zoom out to see the bigger picture
It’s easy to get caught up in every tiny price move but don’t forget to zoom out.
Looking at longer timeframes (like daily or weekly charts) helps you spot the overall trend. That way, you’re not making decisions based on short-term noise.
Always ask yourself: Is this asset trending up, down, or just moving sideways?
Combine chart reading with risk management
Charts can help you time your trades but they don’t protect you from bad decisions. And unlike guitar or cooking, where all you can lose is time, with trading — you can lose your money.
That’s where risk management comes in.
Set clear stop-losses, avoid going all-in on a single trade, and only risk what you can afford to lose. Even pro traders lose trades — what keeps them in the game is controlling how much they lose.
Practice on demo charts first
Before you start trading with real money, try reading and analyzing charts on demo accounts or with trading simulators like Cryptomania.
It’s the best way to learn without the pressure. You can test your ideas, see how patterns play out, and build confidence before putting actual money on the line.
Final thoughts
Let’s be real: no chart, pattern, or indicator can guarantee what the market will do next. If it could, we’d all be rich.
But that’s not the point.
The real power of trading charts isn’t about predicting the future. It’s about being prepared for it. Charts help you spot potential trends, understand market behavior, and make smarter, more informed decisions. They give you a clearer view of what’s happening, so you’re not just guessing or reacting on impulse.
If you’re new to this, don’t feel like you need to master everything today. The best traders didn’t learn it all in one weekend — they took time to study, practice, and improve one chart at a time.
